B2B Budget Benchmarks: how much should you be spending?
As a B2B Marketer, it can be hard to know what ‘realistic’ looks like in a budget. To help, we’ve taken a look at what others in the B2B sphere are asking for – and getting – as well as general trends for B2B marketing budgets.
Check out our 2022 insights now.

The Magic Number
Opinions vary as to how much of your revenue you should spend on marketing.
The CMO Survey: Fall 2019 Report from Deloitte found organisations are, on average, spending 9.8% of their revenue on marketing and 12% of their total company budget.
Whilst Gartner’s Annual CMO Spend Survey 2019-2020 puts that figure higher, with 10.5% of overall revenue going to marketing.
And this figure changes again when you compare industries.
Different industries, different budgets
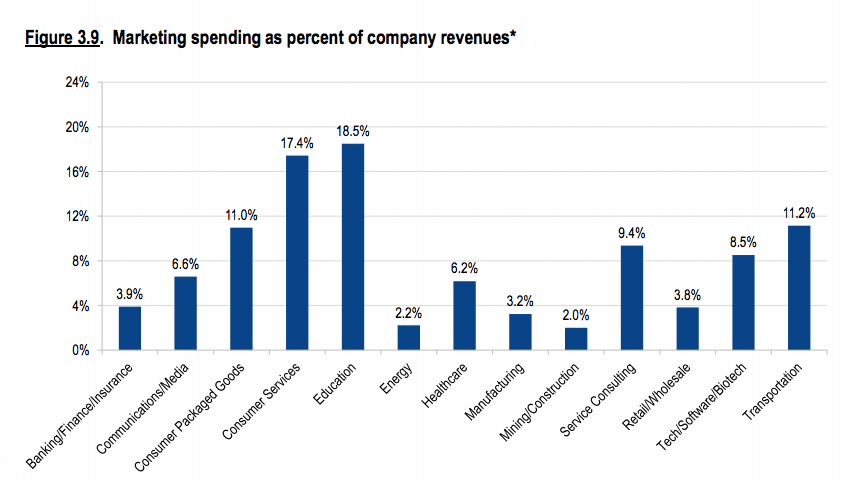
Since 2017, people working in Education, Consumer Services, Consumer Packaged Goods or Transportation typically spend 11% or more of the company’s revenue on marketing.
***
[Header photo: Sharon McCutcheon on Unsplash]
The Magic Number
9-10% of company revenue is the average amount allocated to marketing spend, although it varies by industry
Who gets the bigger slice of pie?
Both B2B and B2C are seeing budgets increase and spend in similar ways, but B2C gets the bigger slice of pie
Let’s get digital
Everyone is shifting focus to spend more on digital and, in the B2B marketing space, spend has increased to over 11%
Sources:
Wall Street Journal
CMO Survey Report of Fall 2019 from Deloitte
Gartner Annual CMO Spend Survey 2019-2020
CMO Survey Highlights and Insights Report 2017
***
[Header photo: Sharon McCutcheon on Unsplash]
Source: CMO Survey August 2019
So in summary:
The Magic Number
9-10% of company revenue is the average amount allocated to marketing spend, although it varies by industry
Who gets the bigger slice of pie?
Both B2B and B2C are seeing budgets increase and spend in similar ways, but B2C gets the bigger slice of pie
Let’s get digital
Everyone is shifting focus to spend more on digital and, in the B2B marketing space, spend has increased to over 11%
Sources:
Wall Street Journal
CMO Survey Report of Fall 2019 from Deloitte
Gartner Annual CMO Spend Survey 2019-2020
CMO Survey Highlights and Insights Report 2017
***
[Header photo: Sharon McCutcheon on Unsplash]
Source: CMO Survey August 2019
Although B2B marketers have less share for their budget, both spend their funds in similar ways.
Let’s get digital
When it comes to media spend traditional media has stabilised or dropped, while digital marketing spend rises – no real surprises there then.
Although the greatest change in digital spend is for B2C services, B2B is not far behind with digital spend increasing by over 11% across the board.
Percent change in traditional advertising vs. digital marketing spend
| Traditional | Digital | |
| B2B Product | 0.58% | 11.43% |
| B2B Services | -0.87% | 11.06% |
| B2C Product | -2.34% | 11.95% |
| B2C Services | 3.38% | 14.47% |
Source: CMO Survey August 2019
So in summary:
The Magic Number
9-10% of company revenue is the average amount allocated to marketing spend, although it varies by industry
Who gets the bigger slice of pie?
Both B2B and B2C are seeing budgets increase and spend in similar ways, but B2C gets the bigger slice of pie
Let’s get digital
Everyone is shifting focus to spend more on digital and, in the B2B marketing space, spend has increased to over 11%
Sources:
Wall Street Journal
CMO Survey Report of Fall 2019 from Deloitte
Gartner Annual CMO Spend Survey 2019-2020
CMO Survey Highlights and Insights Report 2017
***
[Header photo: Sharon McCutcheon on Unsplash]
Source: CMO Survey August 2019
Marketing spending as percent of company revenues
| B2B Product | 10.3% |
| B2B Services | 11.0% |
| B2C Product | 15.5% |
| B2C Services | 14.6% |
Source: CMO Survey August 2019
Although B2B marketers have less share for their budget, both spend their funds in similar ways.
Let’s get digital
When it comes to media spend traditional media has stabilised or dropped, while digital marketing spend rises – no real surprises there then.
Although the greatest change in digital spend is for B2C services, B2B is not far behind with digital spend increasing by over 11% across the board.
Percent change in traditional advertising vs. digital marketing spend
| Traditional | Digital | |
| B2B Product | 0.58% | 11.43% |
| B2B Services | -0.87% | 11.06% |
| B2C Product | -2.34% | 11.95% |
| B2C Services | 3.38% | 14.47% |
Source: CMO Survey August 2019
So in summary:
The Magic Number
9-10% of company revenue is the average amount allocated to marketing spend, although it varies by industry
Who gets the bigger slice of pie?
Both B2B and B2C are seeing budgets increase and spend in similar ways, but B2C gets the bigger slice of pie
Let’s get digital
Everyone is shifting focus to spend more on digital and, in the B2B marketing space, spend has increased to over 11%
Sources:
Wall Street Journal
CMO Survey Report of Fall 2019 from Deloitte
Gartner Annual CMO Spend Survey 2019-2020
CMO Survey Highlights and Insights Report 2017
***
[Header photo: Sharon McCutcheon on Unsplash]
Source: CMO Survey August 2019
In short, marketers in both B2B and B2C are seeing their budgets grow, but B2C is still receives more – both in terms of percentage of overall revenue and budget.
Excluding B2C Services, marketing budgets for both B2B and B2C are growing across the board. But B2B marketing still receives a lower percentage of overall budget and less marketing spend percentage of company revenues.
Marketing budget as percent of firm budget
| B2B Product | 8.6% |
| B2B Services | 8.7% |
| B2C Product | 9.8% |
| B2C Services | 15.6% |
Source: CMO Survey August 2019
Marketing spending as percent of company revenues
| B2B Product | 10.3% |
| B2B Services | 11.0% |
| B2C Product | 15.5% |
| B2C Services | 14.6% |
Source: CMO Survey August 2019
Although B2B marketers have less share for their budget, both spend their funds in similar ways.
Let’s get digital
When it comes to media spend traditional media has stabilised or dropped, while digital marketing spend rises – no real surprises there then.
Although the greatest change in digital spend is for B2C services, B2B is not far behind with digital spend increasing by over 11% across the board.
Percent change in traditional advertising vs. digital marketing spend
| Traditional | Digital | |
| B2B Product | 0.58% | 11.43% |
| B2B Services | -0.87% | 11.06% |
| B2C Product | -2.34% | 11.95% |
| B2C Services | 3.38% | 14.47% |
Source: CMO Survey August 2019
So in summary:
The Magic Number
9-10% of company revenue is the average amount allocated to marketing spend, although it varies by industry
Who gets the bigger slice of pie?
Both B2B and B2C are seeing budgets increase and spend in similar ways, but B2C gets the bigger slice of pie
Let’s get digital
Everyone is shifting focus to spend more on digital and, in the B2B marketing space, spend has increased to over 11%
Sources:
Wall Street Journal
CMO Survey Report of Fall 2019 from Deloitte
Gartner Annual CMO Spend Survey 2019-2020
CMO Survey Highlights and Insights Report 2017
***
[Header photo: Sharon McCutcheon on Unsplash]
Source: The CMO Survey – Highlights and Insights Report 2017, Deloitte
Who gets the bigger slice of pie?
We know marketing budgets differ by industries but what happens when we compare B2B marketing with B2C?
Percent change in marketing budgets
| Past 12 Months | Next 12 Months | |
| B2B Product | 3.2% | 7.1% |
| B2B Services | 8.3% | 10.1% |
| B2C Product | 4.5% | 7.5% |
| B2C Services | 11.9% | 11.1% |
Source: CMO Survey August 2019
In short, marketers in both B2B and B2C are seeing their budgets grow, but B2C is still receives more – both in terms of percentage of overall revenue and budget.
Excluding B2C Services, marketing budgets for both B2B and B2C are growing across the board. But B2B marketing still receives a lower percentage of overall budget and less marketing spend percentage of company revenues.
Marketing budget as percent of firm budget
| B2B Product | 8.6% |
| B2B Services | 8.7% |
| B2C Product | 9.8% |
| B2C Services | 15.6% |
Source: CMO Survey August 2019
Marketing spending as percent of company revenues
| B2B Product | 10.3% |
| B2B Services | 11.0% |
| B2C Product | 15.5% |
| B2C Services | 14.6% |
Source: CMO Survey August 2019
Although B2B marketers have less share for their budget, both spend their funds in similar ways.
Let’s get digital
When it comes to media spend traditional media has stabilised or dropped, while digital marketing spend rises – no real surprises there then.
Although the greatest change in digital spend is for B2C services, B2B is not far behind with digital spend increasing by over 11% across the board.
Percent change in traditional advertising vs. digital marketing spend
| Traditional | Digital | |
| B2B Product | 0.58% | 11.43% |
| B2B Services | -0.87% | 11.06% |
| B2C Product | -2.34% | 11.95% |
| B2C Services | 3.38% | 14.47% |
Source: CMO Survey August 2019
So in summary:
The Magic Number
9-10% of company revenue is the average amount allocated to marketing spend, although it varies by industry
Who gets the bigger slice of pie?
Both B2B and B2C are seeing budgets increase and spend in similar ways, but B2C gets the bigger slice of pie
Let’s get digital
Everyone is shifting focus to spend more on digital and, in the B2B marketing space, spend has increased to over 11%
Sources:
Wall Street Journal
CMO Survey Report of Fall 2019 from Deloitte
Gartner Annual CMO Spend Survey 2019-2020
CMO Survey Highlights and Insights Report 2017
***
[Header photo: Sharon McCutcheon on Unsplash]
Source: The CMO Survey – Highlights and Insights Report 2017, Deloitte
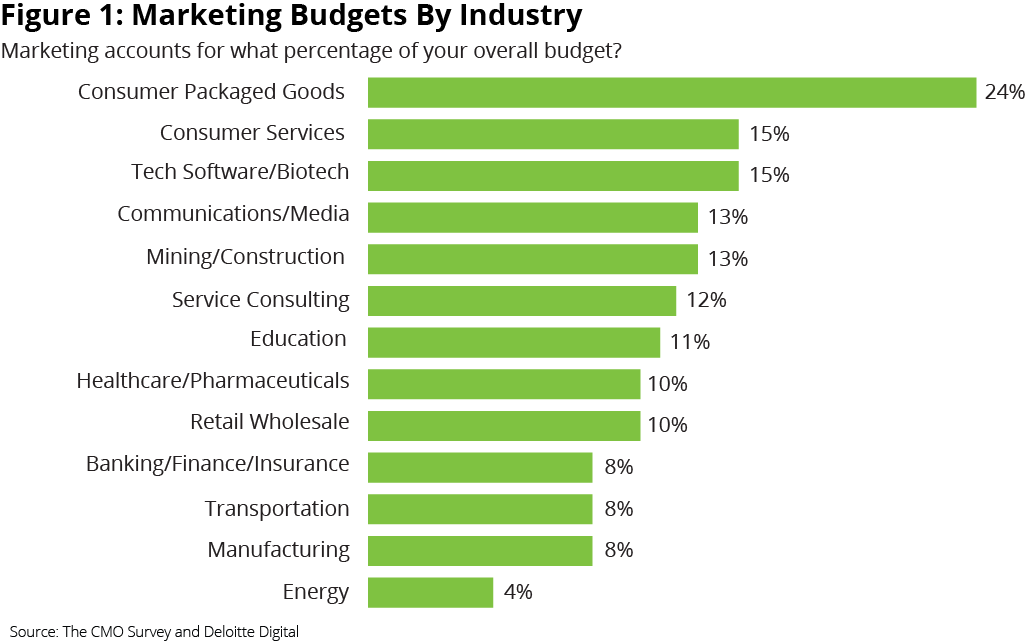
And when we take a look at marketing budgets as percentages of a company’s overall budget, those in the Consumer Packaged Good sector allocate almost a full quarter of theirs, whilst the Consumer Services and Tech Software/Biotech industries allocate 15%, and Communications/Media and Mining/Construction each put 13%.
Source: The CMO Survey – Highlights and Insights Report 2017, Deloitte
Who gets the bigger slice of pie?
We know marketing budgets differ by industries but what happens when we compare B2B marketing with B2C?
Percent change in marketing budgets
| Past 12 Months | Next 12 Months | |
| B2B Product | 3.2% | 7.1% |
| B2B Services | 8.3% | 10.1% |
| B2C Product | 4.5% | 7.5% |
| B2C Services | 11.9% | 11.1% |
Source: CMO Survey August 2019
In short, marketers in both B2B and B2C are seeing their budgets grow, but B2C is still receives more – both in terms of percentage of overall revenue and budget.
Excluding B2C Services, marketing budgets for both B2B and B2C are growing across the board. But B2B marketing still receives a lower percentage of overall budget and less marketing spend percentage of company revenues.
Marketing budget as percent of firm budget
| B2B Product | 8.6% |
| B2B Services | 8.7% |
| B2C Product | 9.8% |
| B2C Services | 15.6% |
Source: CMO Survey August 2019
Marketing spending as percent of company revenues
| B2B Product | 10.3% |
| B2B Services | 11.0% |
| B2C Product | 15.5% |
| B2C Services | 14.6% |
Source: CMO Survey August 2019
Although B2B marketers have less share for their budget, both spend their funds in similar ways.
Let’s get digital
When it comes to media spend traditional media has stabilised or dropped, while digital marketing spend rises – no real surprises there then.
Although the greatest change in digital spend is for B2C services, B2B is not far behind with digital spend increasing by over 11% across the board.
Percent change in traditional advertising vs. digital marketing spend
| Traditional | Digital | |
| B2B Product | 0.58% | 11.43% |
| B2B Services | -0.87% | 11.06% |
| B2C Product | -2.34% | 11.95% |
| B2C Services | 3.38% | 14.47% |
Source: CMO Survey August 2019
So in summary:
The Magic Number
9-10% of company revenue is the average amount allocated to marketing spend, although it varies by industry
Who gets the bigger slice of pie?
Both B2B and B2C are seeing budgets increase and spend in similar ways, but B2C gets the bigger slice of pie
Let’s get digital
Everyone is shifting focus to spend more on digital and, in the B2B marketing space, spend has increased to over 11%
Sources:
Wall Street Journal
CMO Survey Report of Fall 2019 from Deloitte
Gartner Annual CMO Spend Survey 2019-2020
CMO Survey Highlights and Insights Report 2017
***
[Header photo: Sharon McCutcheon on Unsplash]